← All projectsComputer graphics project · 2026

SAH k-d Tree Ray Tracer

A CPU ray tracer with an SAH-optimized k-d tree and an adaptive bucketing strategy for fast construction.

X axisY axis
scene bounds
SAH split
bucket candidate
FULL SAH
BUCKETS
// construction strategy

Spend precision where it matters.

Large nodes use a fixed number of sampled buckets to keep construction practical. Near the leaves, the implementation switches back to exact SAH evaluation so the final splits stay precise.

10test scenes
218kpolygons in A10
02SAH strategies
CPUANSI C++ implementation
// technical problem

Accelerate the expensive part of ray tracing

A naive ray tracer tests every triangle against every ray. The k-d tree reduces that work by recursively partitioning space, but constructing a high-quality tree can itself become expensive.

I implemented the Surface Area Heuristic as the cost model for choosing split planes. The exact variant evaluates all triangle bounds; the approximate variant uses bucketing to limit the number of candidates in large nodes. This creates a controlled trade-off between build time and traversal quality.
// implementation

From triangle bounds to traversal

01

Candidate planes

Each triangle contributes minimum and maximum bounds on all three axes, producing six possible split events.

02

SAH cost

For each candidate, the implementation estimates left and right surface areas, primitive counts and traversal cost.

03

Adaptive buckets

Large nodes use sampled buckets. When a node becomes small enough, construction switches to FULL SAH.

04

Stable partition

Sorted primitive lists are propagated into child nodes with a linear stable pass instead of repeated full sorting.

05

Measured traversal

Build time, traversal steps and ray–triangle intersection tests are recorded for every scene and strategy.

// measured results

SAH versus naive intersection work

The clearest baseline is the number of triangle intersection tests per ray. The cards use one consistent configuration — Approx. SAH with bucketing — and compare it first with the naive estimate, then with the report's reference TDBVH (a BVH-style hierarchy). Against TDBVH I show both traversal steps, hit tests and total trace time.

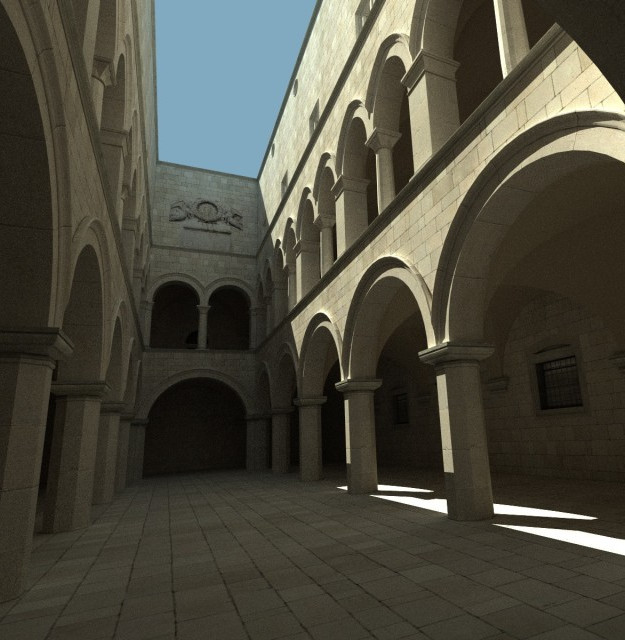
Representative Sponza atrium render
Representative Sponza render
2,418× fewertriangle tests / ray vs naive
SAH vs naive · hit tests

~67,697 → 28 hit tests / ray

SAH vs TDBVH

Traversal: 95 vs 293 / ray
Hit tests: 28 vs 27 / ray
1.77× faster trace (3.62 s vs 6.40 s)

Approx. SAH · build 6.5 s · trace 3.62 s · 135,394 triangles from repository OBJ
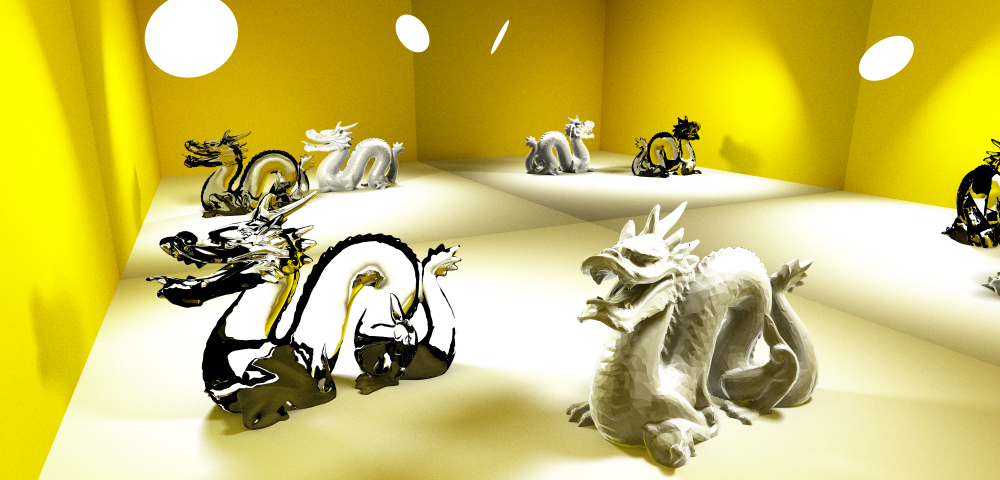
Representative Asian Dragon scene render
Representative Asian Dragon render
902,363× fewertriangle tests / ray vs naive
SAH vs naive · hit tests

~3,609,453† → 4 hit tests / ray

SAH vs TDBVH

Traversal: 33 vs 32 / ray
Hit tests: 4 vs 3 / ray
0.87× trace time · TDBVH is 1.15× faster (1.07 s vs 0.93 s)

Approx. SAH · build 150.1 s · trace 1.07 s · ~7.22M-triangle benchmark estimate†
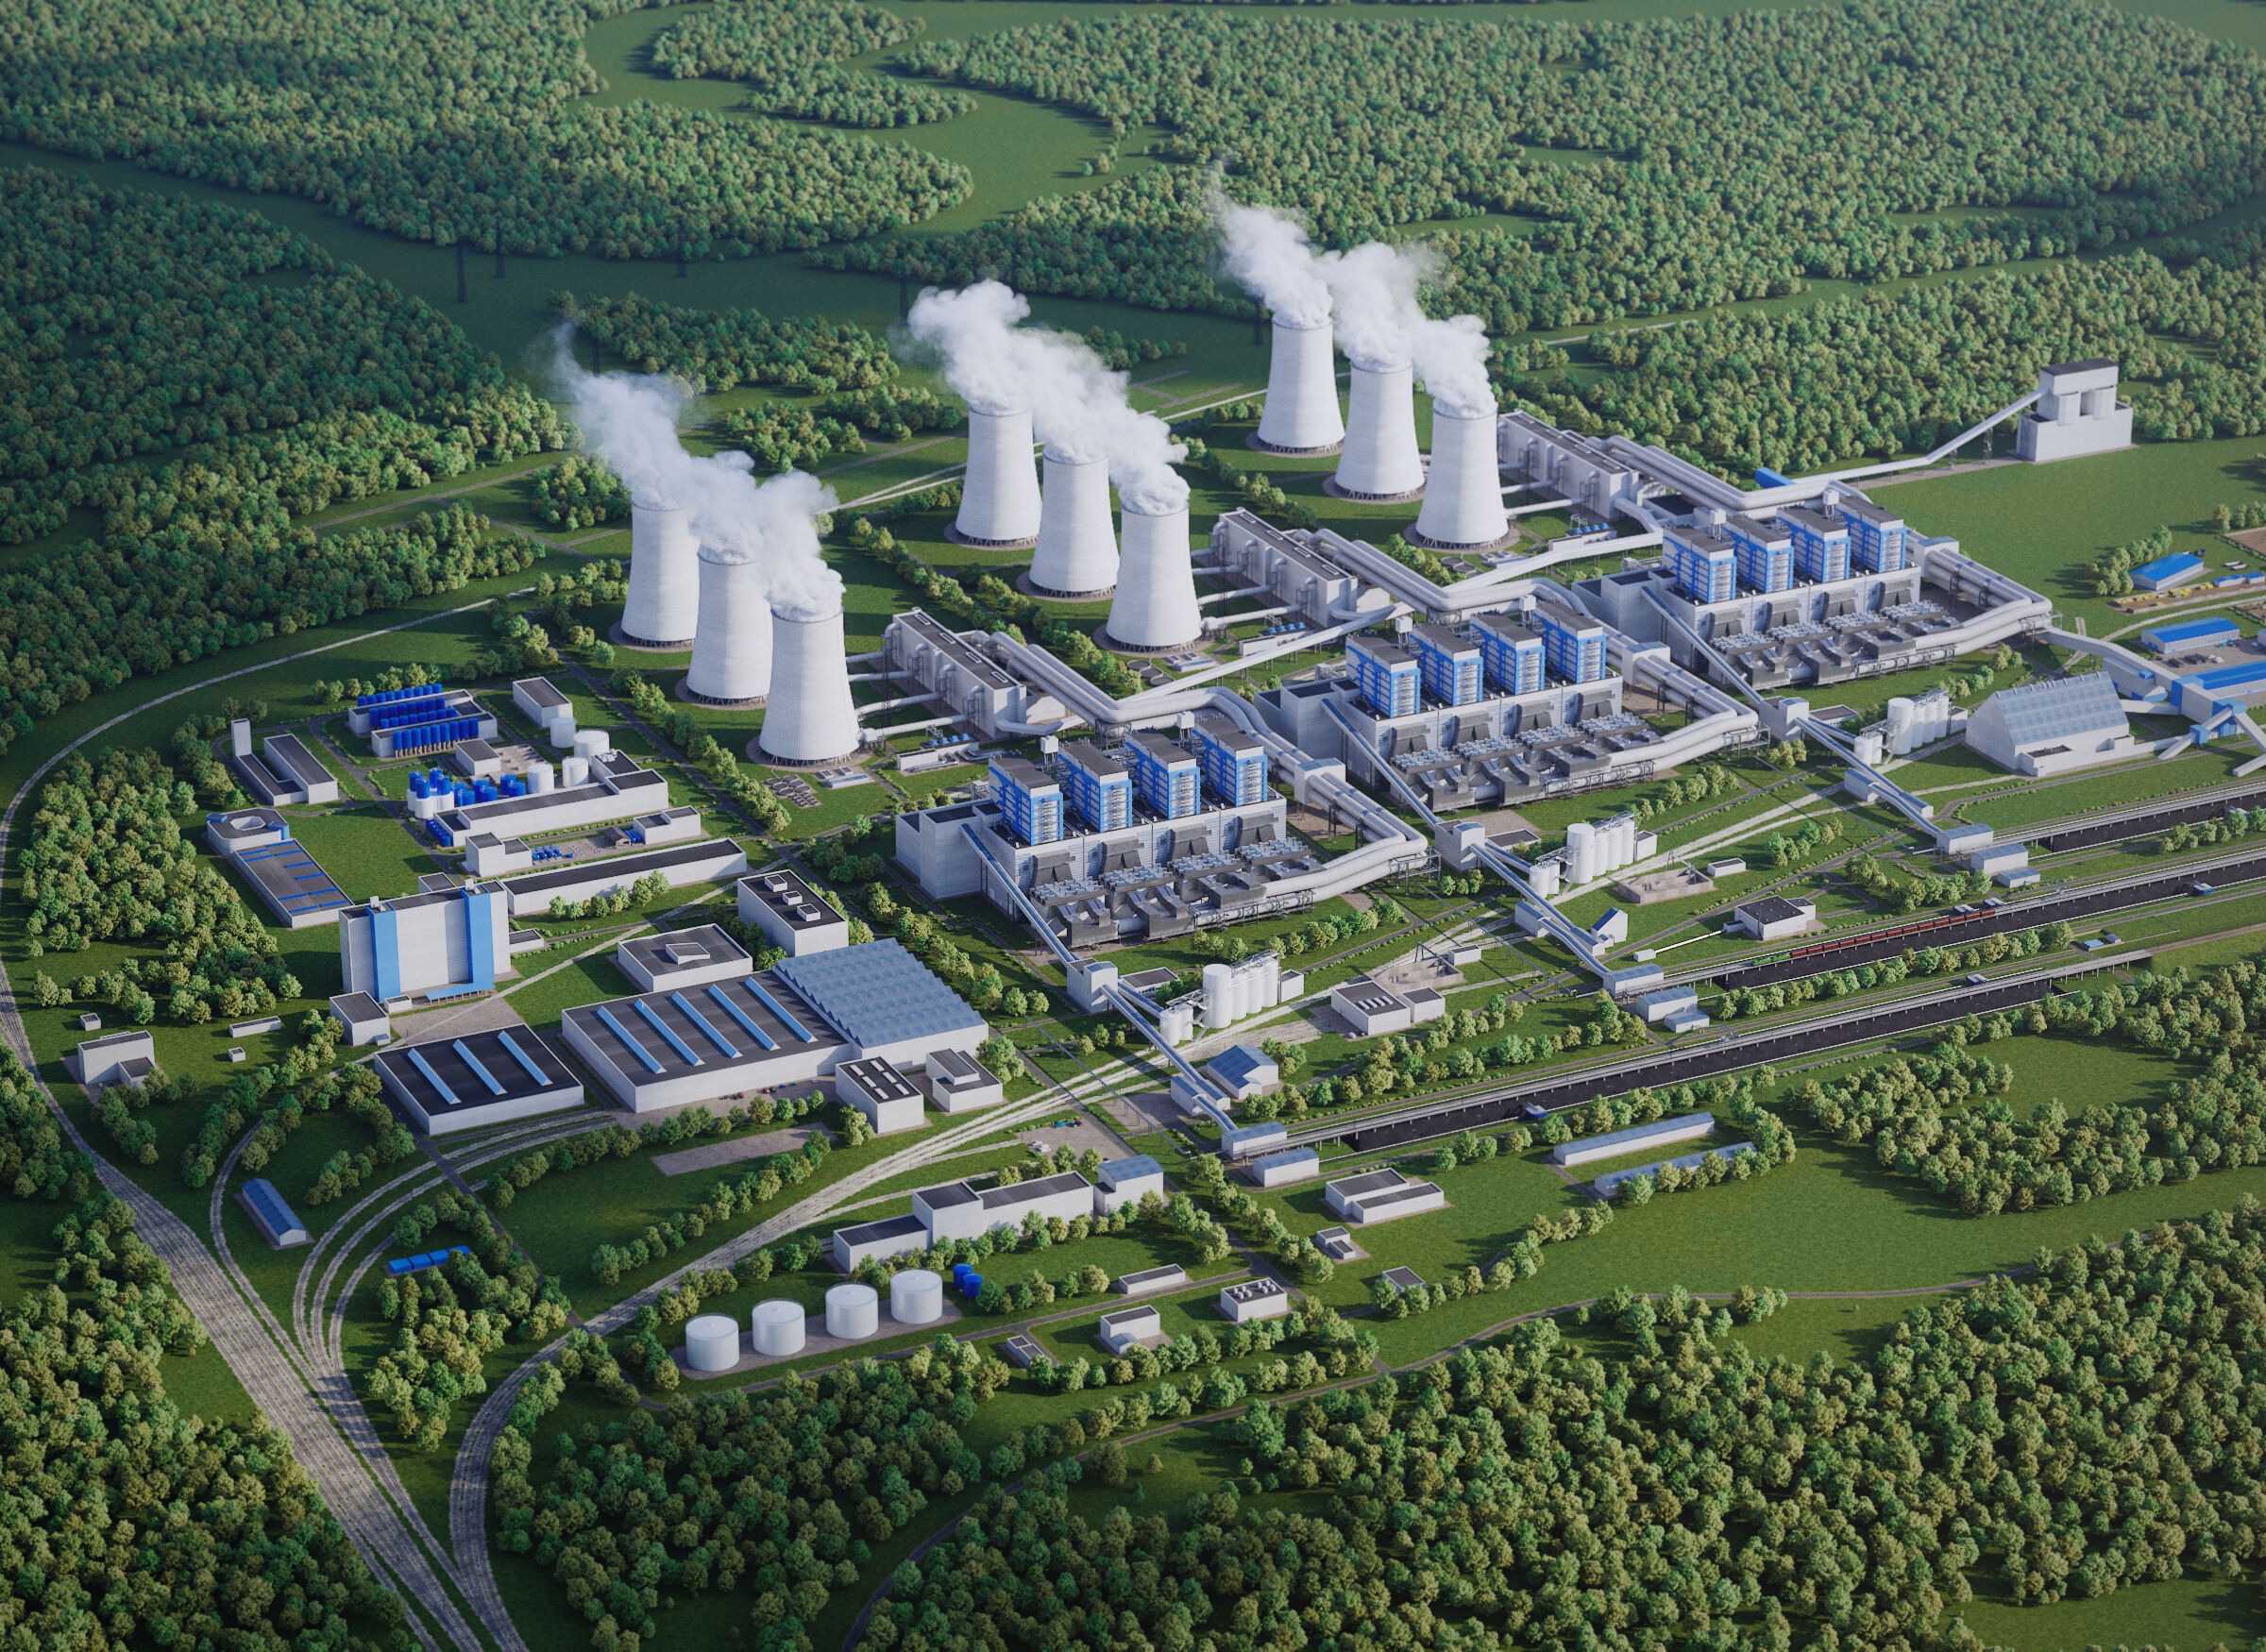
Representative PowerPlant scene render
Representative PowerPlant view
288,636× fewertriangle tests / ray vs naive
SAH vs naive · hit tests

~6,350,000† → 22 hit tests / ray

SAH vs TDBVH

Traversal: 55 vs 146 / ray
Hit tests: 22 vs 10 / ray
1.37× faster trace (2.62 s vs 3.60 s)

Approx. SAH · build 223.8 s · trace 2.62 s · ~12.7M triangles†
SceneFULL SAHApprox. SAH
Build sTrace sTests / rayBuild sTrace sTests / ray
Conference7.32.40236.52.5024
A105.40.4823.90.472
Sponza7.53.51286.53.6228
Šibenik1.21.71111.11.6710
PowerPlant286.72.7123223.82.6222
HairBall154.74.9037112.35.1039
Armadillo6.70.9154.70.935
Asian Dragon233.51.074150.11.074
Gallery30.02.791521.62.7814
City1.71.0371.50.946

The large multipliers are reductions in hit tests per ray against the naive estimate, not end-to-end render-time speedups. The TDBVH comparison uses measured traversal steps / ray, hit tests / ray and total trace time. All values come from the single mode / single-threaded CPU measurement; no GPU acceleration is involved. All SAH values use the Approx. SAH row from the report. † Sponza is counted from the repository OBJ, while Asian Dragon and PowerPlant polygon counts are standard public benchmark estimates.

// engineering notes

What the measurements exposed

01

SAH makes the reduction visible

Across the selected scenes, the measured SAH result stays between four and 28 triangle tests per ray while the naive estimate grows into the millions.

02

Traversal order matters

The final implementation uses a stack-based traversal. HairBall shows the cost of not visiting the nearest node first when many bounding volumes overlap.

03

Approximation can be enough

Bucket sampling reduces construction time while keeping the number of tests per ray close to FULL SAH in most of the tested scenes.

// project evidence
Source repositoryANSI C++ ray tracer and SAH k-d tree implementation ↗
Interested in graphics performance?

Let's build the structure behind the image.

Work with me →